| About | |
| Creationism Research | |
| Biblical Research | |
| Bamboo Research | |
| Oak Research | |
| Contact |
|
|
|||||||||||||||||||||||||||||||||||||||||||||||||||||||||||||||||||||||||||||||||||||||||||||||||||||||||||||||||||||||||||||||||||||||||||||||||||||||||||||||||||||||||||||||||||||||||||||||||||||||||||||||||||||||||||||||||||||||||||||||||||||||||||||||||||||||||||||||||||||||||||||||||||||||||
CHAPTER 4RESULTS4.1 Problems EncounteredDuring the fieldwork several difficulties were experienced. Many trees, both those in the roadside and field samples, proved to be non-measurable because of obstructing vegetation, usually ivy (Hedera helix) around the trunk. A sample was taken of the number of ivy-covered trees encountered during one day of the roadside tree survey as shown in Table 4. Table 4: The Proportion of Non-Measurable Trees Encountered During One Day of Roadside Sampling
In the field transects the number of non-measurable trees was less than 72 percent. As the purpose of the survey was not to count the numbers of oak trees present, but to gather information an their health, size and timber potential, the non-measurable trees were excluded from the sample. In order to do this and still be able to use the results, it was assumed that obstructions to measurement appeared randomly throughout the tree population. In practice this seemed to be the case. 4.2.1 General ResultsIn total 515 trees were measured, and the data collected from them was transferred from the booking forms onto computer files. The data was then processed as described in Section 3.3. The results are summarized in Table 24, which shows the mean, standard deviation and coefficient of variance of every factor which was examined. 4.2.2 Transect detailsAll the field transects were 200 metres wide. Table 5 shows the length of each transect and the approximate basal area per hectare of oak trees that it contained. Transect 1 contained no oak trees and so it was excluded from further analysis. Table 5: General results for measurable oak tree basal area hectare
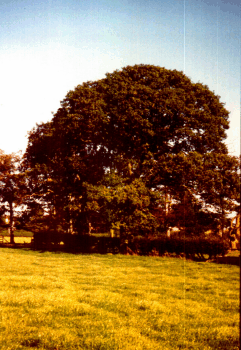
4.2.3 Diameter MeasurementsFigure 1 shows graphically the diameter distribution of the trees in each of the samples. It is clear from the histograms that there is a very uneven dbh distribution, with a mean of 60 cm. By counting the growth rings of a felled tree it was estimated that trees of this size were about 130 years old. Photogragh 3 shows a typical tree from Transect 4. Photograph 3: Typical Tree From Transect 4
16 m tall, dbh 78cm and timber height 4m (Tree No. 258)The is quite a marked difference between these results and those of the 1979-82 Tree Census (Forestry Commission, 1984) of Merseyside (Table 6). The tree census covered all of Merseyside and not just the Wirral, it is possible that the Wirral is not typical of all areas. This could be due to a difference in farming practice and in the ownership pattern of the land. Table 6: Percent dbh Distributions for Roadside Trees, Transects 2-6 and Forestry Commission 1984).
4.2.4 Sawlog PotentialThe estimated timber volume for each tree was calculated as described in Section 3.3.3. A millable sawlog was defined as any log which was at least 2 metres long ( = timber height of 2 m) (Forestry Commission, 1984), with no cracks in the bark, cavities or signs of fungal decay. The tree health factors were derived from their respective columns on the booking form. Table 7 shows the percentage of millable sawlogs in each sample, which on average was 27 percent. Table 7: Percent Millable* Sawlogs In Each Sample
* A millable tree is defined as any tree having a timber height of 2 metres or more, with no cavities, cracks in its bark or any signs of fungal decay.4.2.5 Tree HealthFigure 2 shows the condition of the trees in terms of general maturity classes in the form of pie-charts (See also Table 25). It is clear from these that most of the oak trees sampled were over-mature, and That there were rarely any young trees within the population. Figure 3 illustrates the percentage of each sample that had dead. branches, cracks in their bark, cavities or signs of fungal decay. The low instance of ‘signs of decay’ in the roadside sample was perhaps due to inexperience in sampling rather than a significant difference in the population. Generally the six samples show a similar distribution of each factor (see also Table 26) 4.3 Results of Statistical Tests A one-way analysis of variance (ANOVA Test) was carried out on three sections of the data collected: the dbh, the total height and total volume. Tables 8, 9 and 10 show the 95 percent confidence interval for each of these results. Transect 4 (T4) had, apparently, a larger dbh and total height than the other transects and hence a larger total volume. This apparent difference was tested using Scheff’s method. Tables 11, 12 and 13 contain the results of this test. In Table 11, the dbh of the trees in T4 were significantly different from those in the roadside sample and in T2 and T3. Table 12 shows that T4 was different in height from all but the trees in T3. T3 was significantly different from the roadside trees and those in T2. Table 11: Results of Scheff's Test of Significance on DBH of Sample Trees
KEY: * = significant at the 95% levelns = Not significant at 95% levelTable 12: Results of Scheff's Test of Significance on Total Heights of Sample Trees
KEY: * = significant at the 95% levelns = Not significant at 95% levelFrom this the total volume results (Table 13) are predictable, as the total volume is derived from dbh and total height (Section 3.3.3). The trees in transect 4 were significantly larger than those in the other samples. This is likely to be due to a combination of factors. T4 runs through the centre of the Lever-Hulme Estate, where trees would presumably be planted first, and would therefore be older. Another possible contributing factor might be that there were more trees of all species within T3 and T4, leading to a mutual sheltering effect and hence increased growth. Table 13: Results of Scheff's Test of Significance on Total Volume of Sample Trees
KEY: * = significant at the 95% levelns = Not significant at 95% level© 1987 Robert I. BradshawGo on to Chapter 5 |
|||||||||||||||||||||||||||||||||||||||||||||||||||||||||||||||||||||||||||||||||||||||||||||||||||||||||||||||||||||||||||||||||||||||||||||||||||||||||||||||||||||||||||||||||||||||||||||||||||||||||||||||||||||||||||||||||||||||||||||||||||||||||||||||||||||||||||||||||||||||||||||||||||||||||